
ssh
SSH server
Server dashboard via ssh:// — CPU, RAM, Docker, embedded terminal, and security audit.
ssh://user:password@host:22The story
Dev owns ssh://prod-web — the node that runs nginx, Docker, and the API that pages at 3 a.m. Old workflow: PuTTY for shell, htop in SSH, Docker Desktop SSH plugin for containers, another tab for disk. Health context scattered; logs in a terminal buffer lost on disconnect.
Dev saved ssh://prod-web with a key in the vault. Connect shows CPU, RAM, disk, open ports, Docker containers, and a production checklist before anyone runs sudo. Embedded terminal tails nginx beside a Postgres query tab. Security audit scores firewall and SSH hardening with copy-paste remediation — run before opening 5432 to the world.
ssh:// in Bridge is a command center, not just a shell window.

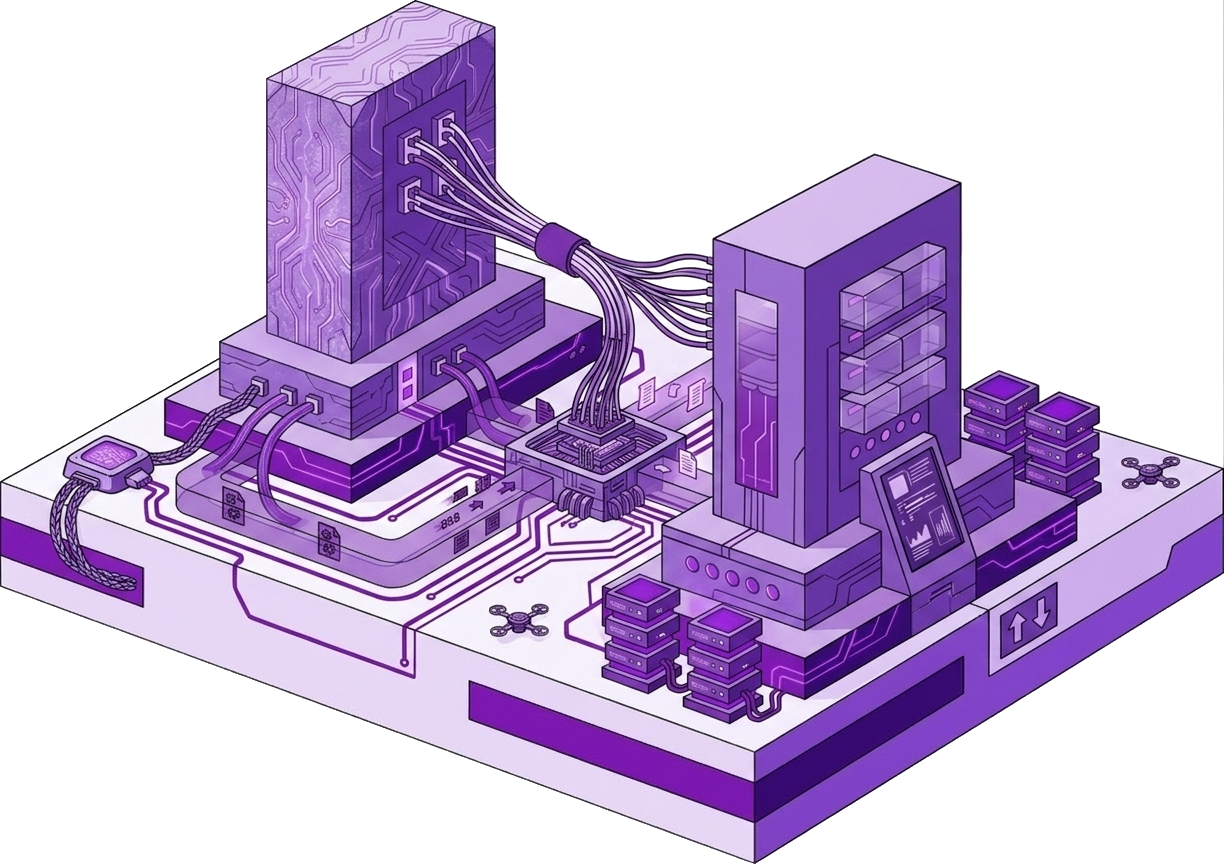
Connection URL
Scheme: ssh://
Parameters
ssh://user:password@host:22 — Opens CPU, RAM, disk, Docker, and deploy tools — not the same as sftp://.
ssh://user@host:22?privateKey=URL_ENCODED_PEM
Step 1
Health dashboard
Swap climbs past 85%; health score turns amber before API latency spikes hit customers. Dev spots the trend on connect, checks Processes, finds a runaway worker — fixes before paging the team.
CPU, memory, disk, load averages, and open ports in one view.
Server overview on ssh:// connect: resource sparklines, uptime, and checklist items. Links into Processes, Docker, and Security panels. Not the same as sftp:// — file transfer uses a separate scheme.
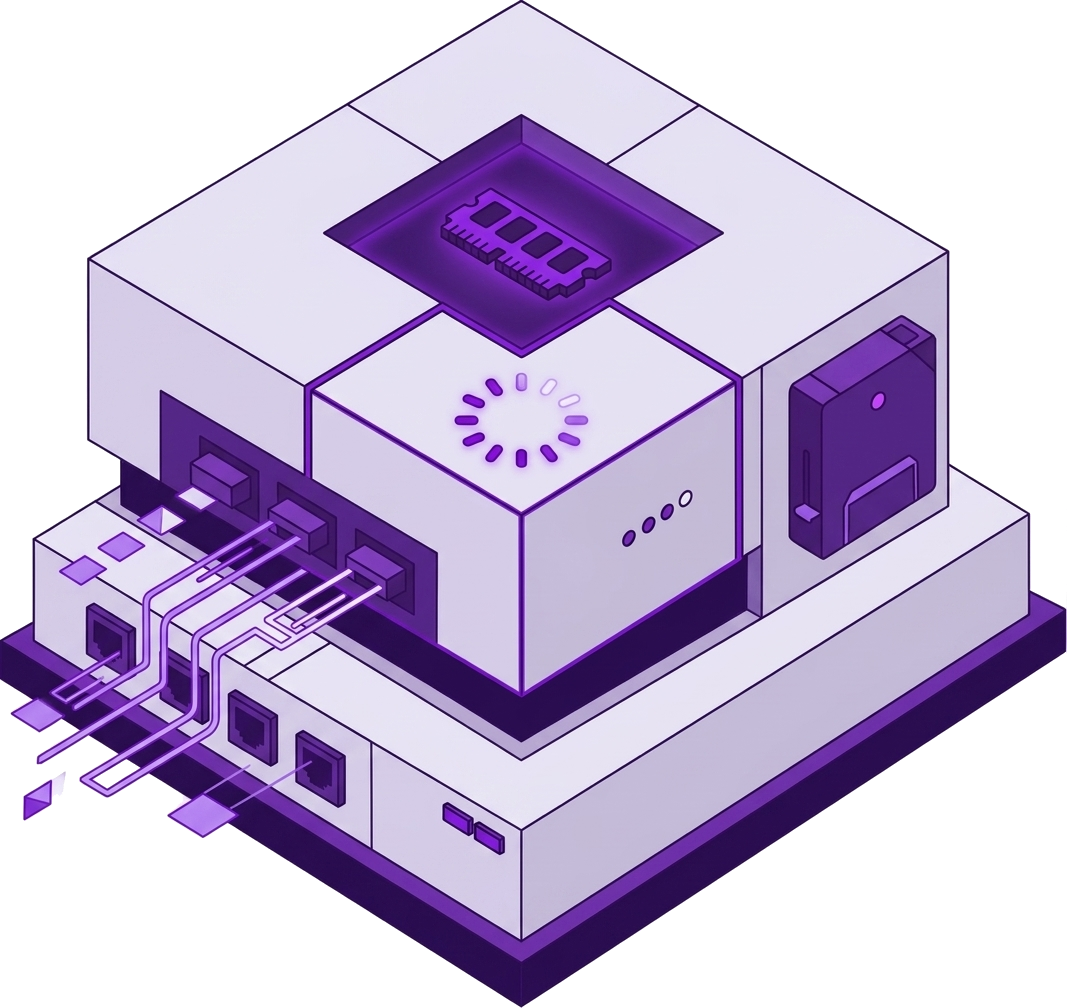
Step 2
Embedded terminal
Dev tails journalctl -u nginx -f in the embedded terminal while running EXPLAIN on a slow query in the database tab — no Alt-Tab to another SSH client, scrollback preserved.
serverExec() via nexoxa-bridge-sdk automates the same session for CI.
Full SSH shell with scrollback. Password or privateKey URL params. Terminal beside database and transfer studios in one window.
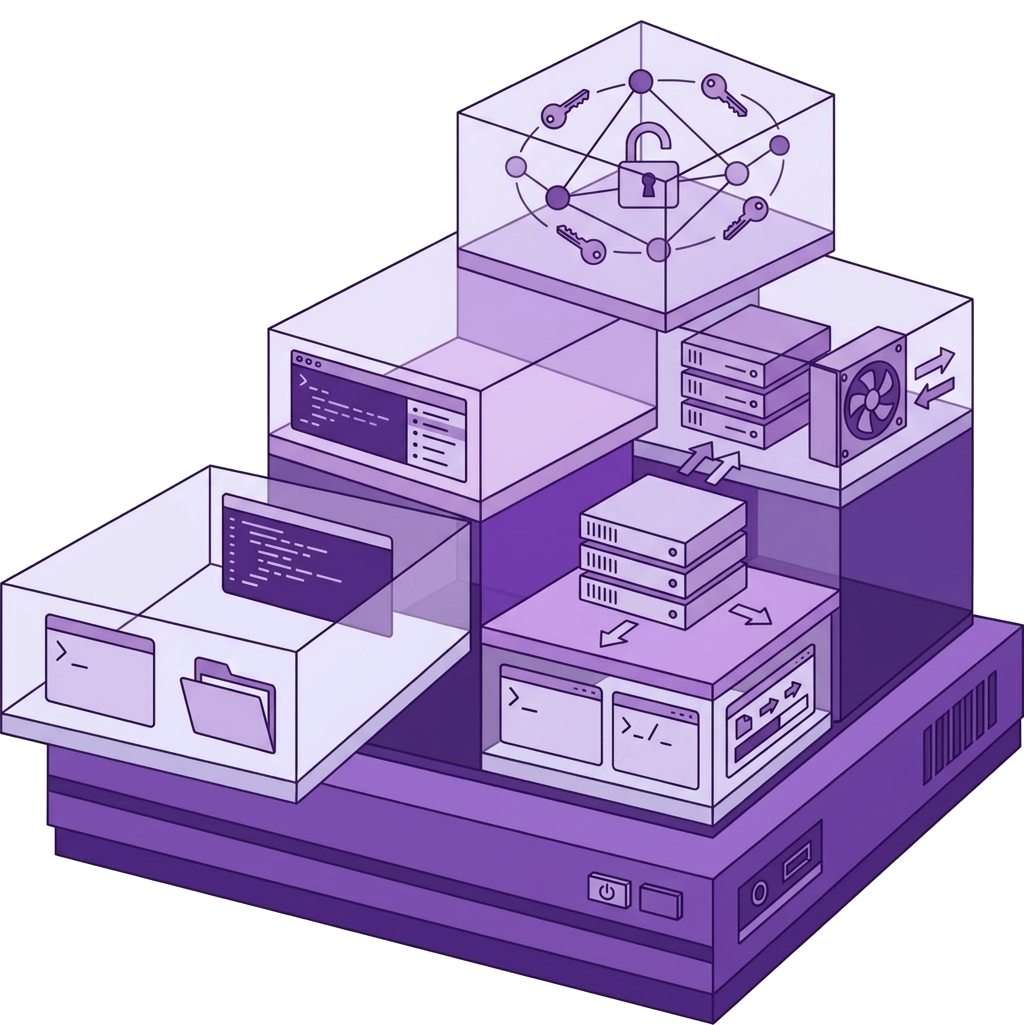
Step 3
Docker & processes
CPU pegged at 100% — Docker panel shows api-worker stuck restarting. Dev restarts the container from the UI, maps PID to port 8080 in Processes, confirms traffic stabilizes.
Container list, resource usage, and quick actions without raw docker ps typing.
Docker browser with restart/stop actions. Process list sorted by CPU/memory with port mapping. Infrastructure panels under ssh:// server nav.

Step 4
Security audit
Before exposing Postgres publicly Dev runs the security audit — firewall gaps and weak SSH settings surface with severity scores. fail2ban remediation copies into the terminal in one click.
Audit runs locally; findings do not upload to Nexoxa cloud.
Checklist covers SSH hardening, exposed ports, SSL/TLS posture, and firewall rules. Remediation snippets for common fixes. Pair with Ports & links panel for listener verification.

Next
Explore the full feature guide: SSH dashboards feature