
Reliability
Observability
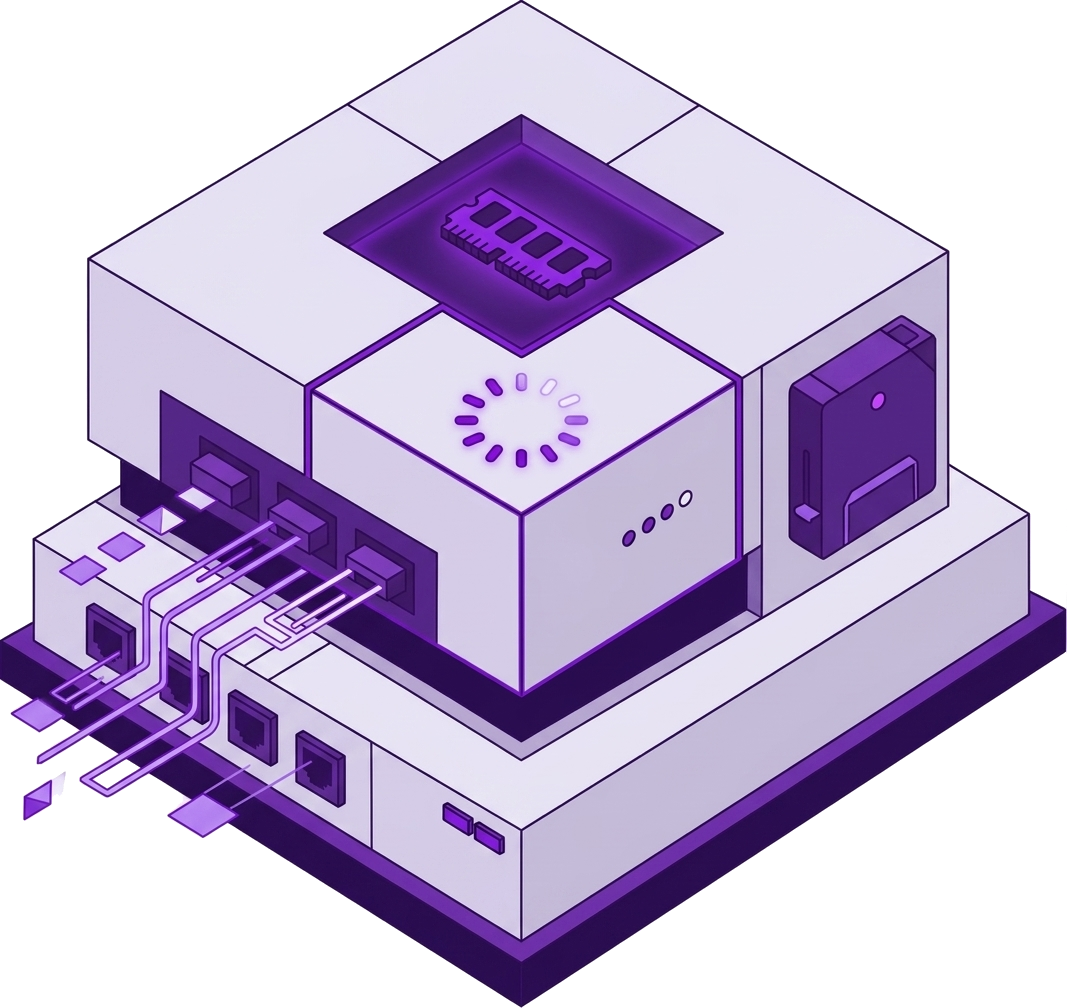
DB telemetry when Postgres is co-located.
The story
These pages use illustrative scenarios to walk through real workbench panels. Sidebar labels, Bridge paths, and connection schemes match the app; characters and timelines are examples for learning.
Postgres on same host — Observability shows buffer, WAL, connection time-series.
DB telemetry beside server RAM during incident.
Bridge path: /server/observability
Step 1
Co-located Postgres metrics
WAL spike during bulk import — correlates with disk IO.
Throttle import.
DB telemetry when Postgres is co-located. /server/observability.
Step 2
Time-series context
Connection count growth — pool misconfig.
App config fix.
When Postgres co-located via SSH.
Step 3
Open database tab
Switch to postgres:// on same host for Query lab.
Two lenses one incident.
Pair database connect docs.
This panel appears in the Nexoxa Bridge left sidebar after you connect with the matching connection URL. See the connection docs above for
postgresql://, ssh://, sftp://, s3://, or smtp:// examples.Related connections